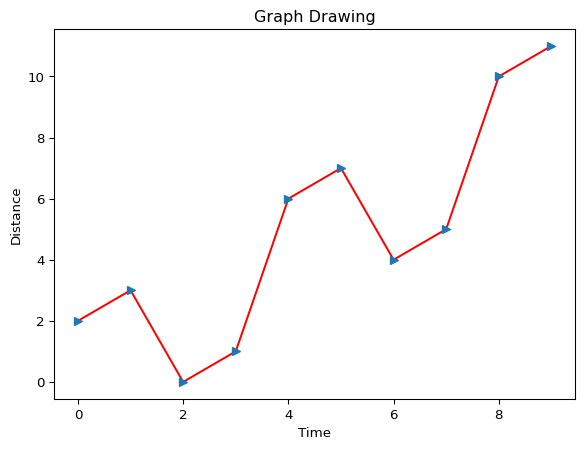
import numpy as np
import matplotlib.pyplot as plt
x = np.arange(0, 10)
y = x ^ 2
# Labeling the Axes and Title
plt.title("Graph Drawing")
plt.xlabel("Time")
plt.ylabel("Distance")
# Formatting the line colors
plt.plot(x, y, 'r')
# Formatting the line type
plt.plot(x, y, '>')
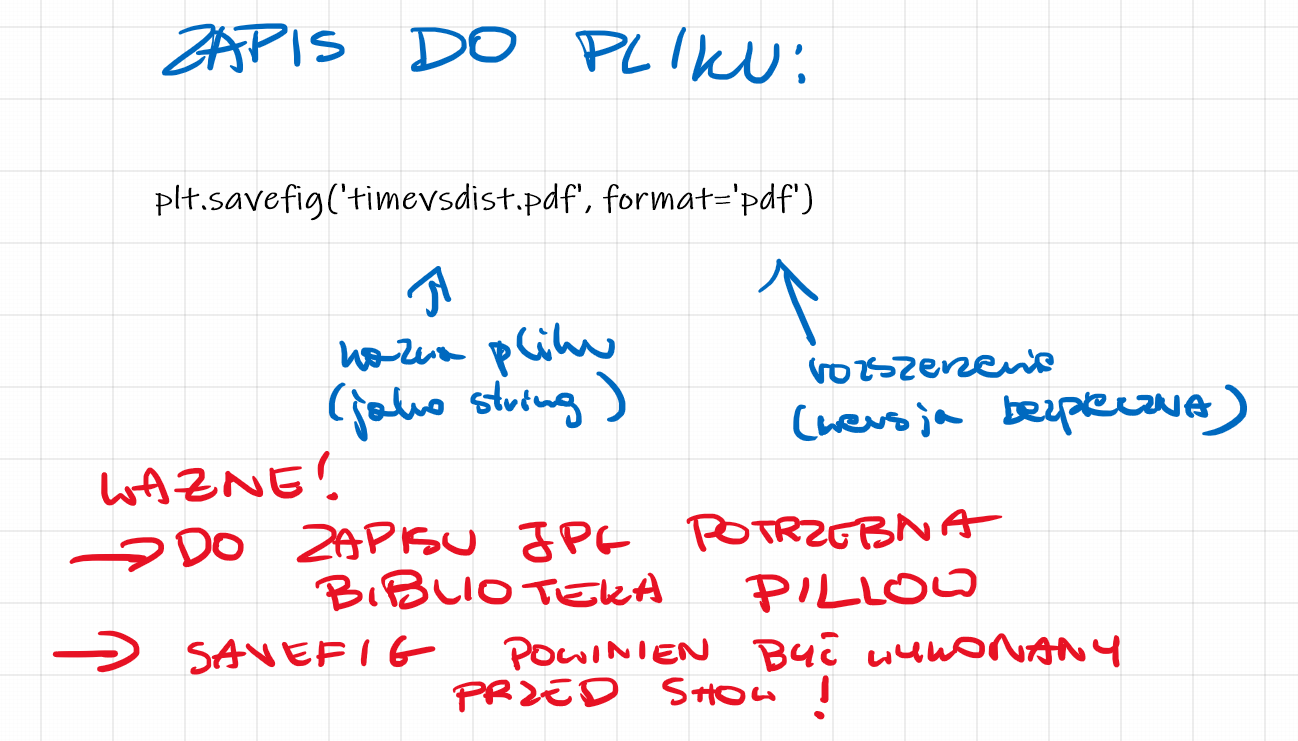
# save in pdf formats
plt.savefig('timevsdist.pdf', format='pdf')