Pandas jest biblioteką Pythona służącą do analizy i manipulowania danymi
Podstawowe byty
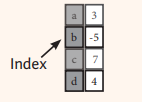
Seria - Series
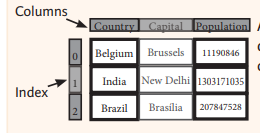
Ramka danych - DataFrame
import pandas as pd= pd.Series([3 , - 5 , 7 , 4 ])print (s)print ("values" )print (s.to_numpy())print (type (s.to_numpy()))print (s.index)print (type (s.index))
0    3
1   -5
2    7
3    4
dtype: int64
values
[ 3 -5  7  4]
<class 'numpy.ndarray'>
RangeIndex(start=0, stop=4, step=1)
<class 'pandas.RangeIndex'>
import pandas as pdimport numpy as np= pd.Series([3 , - 5 , 7 , 4 ], index= ['a' , 'b' , 'c' , 'd' ])print (s)print (s['b' ])'b' ] = 8 print (s)print (s[s > 5 ])print (s * 2 )print (np.sin(s))
a    3
b   -5
c    7
d    4
dtype: int64
-5
a    3
b    8
c    7
d    4
dtype: int64
b    8
c    7
dtype: int64
a     6
b    16
c    14
d     8
dtype: int64
a    0.141120
b    0.989358
c    0.656987
d   -0.756802
dtype: float64
import pandas as pd= {'key1' : 350 , 'key2' : 700 , 'key3' : 70 }= pd.Series(d)print (s)
key1    350
key2    700
key3     70
dtype: int64
import pandas as pd= {'key1' : 350 , 'key2' : 700 , 'key3' : 70 }= ['key0' , 'key2' , 'key3' , 'key1' ]= pd.Series(d, index= k)print (s)= "Wartosc" = "Klucz" print (s)
key0      NaN
key2    700.0
key3     70.0
key1    350.0
dtype: float64
Klucz
key0      NaN
key2    700.0
key3     70.0
key1    350.0
Name: Wartosc, dtype: float64
import pandas as pd= {'Country' : ['Belgium' , 'India' , 'Brazil' ],'Capital' : ['Brussels' , 'New Delhi' , 'Brasília' ],'Population' : [11190846 , 1303171035 , 207847528 ]}= pd.DataFrame(data)print (frame)= pd.DataFrame(data, columns= ['Country' , 'Population' , 'Capital' ])print (data2)
   Country    Capital  Population
0  Belgium   Brussels    11190846
1    India  New Delhi  1303171035
2   Brazil   Brasília   207847528
   Country  Population    Capital
0  Belgium    11190846   Brussels
1    India  1303171035  New Delhi
2   Brazil   207847528   Brasília
import pandas as pd= {'Country' : ['Belgium' , 'India' , 'Brazil' ],'Capital' : ['Brussels' , 'New Delhi' , 'Brasília' ],'Population' : [11190846 , 1303171035 , 207847528 ]}= pd.DataFrame(data, columns= ['Country' , 'Population' , 'Capital' ])print ("Shape:" , df_data.shape)print ("--" )print ("Index:" , df_data.index)print ("--" )print ("columns:" , df_data.columns)print ("--" )print ("--" )print (df_data.count())
Shape: (3, 3)
--
Index: RangeIndex(start=0, stop=3, step=1)
--
columns: Index(['Country', 'Population', 'Capital'], dtype='str')
--
<class 'pandas.DataFrame'>
RangeIndex: 3 entries, 0 to 2
Data columns (total 3 columns):
 #   Column      Non-Null Count  Dtype
---  ------      --------------  -----
 0   Country     3 non-null      str
 1   Population  3 non-null      int64
 2   Capital     3 non-null      str
dtypes: int64(1), str(2)
memory usage: 204.0 bytes
--
Country       3
Population    3
Capital       3
dtype: int64
Ćwiczenia: (ex8.py)
Napisz kod, który utworzy serię z następującej listy liczb: [10, 20, 30, 40, 50]. Wyświetl serię w formacie tabelarycznym:
Utwórz serię, gdzie kluczami będą miesiące ('Jan', 'Feb', 'Mar'), a wartościami odpowiednie temperatury: [0, 3, 5]. Wyświetl w formacie tabelarycznym:
Stwórz pustą ramkę danych z kolumnami Product, Price, Quantity, a następnie wypełnij ją danymi:
Apple
1.2
10
Banana
0.5
20
Orange
0.8
15